import os
import pandas as pd
import numpy as np
import matplotlib.pyplot as plt
import matplotlib.ticker as ticker
import matplotlib.patches as patches
import matplotlib.animation as animation
# Per l'embedding in Jupyter e MyST-MD
from IPython.display import HTML

BASE_FOLDER = "../../../CODICI/HARMONIC_OSCILLATOR"
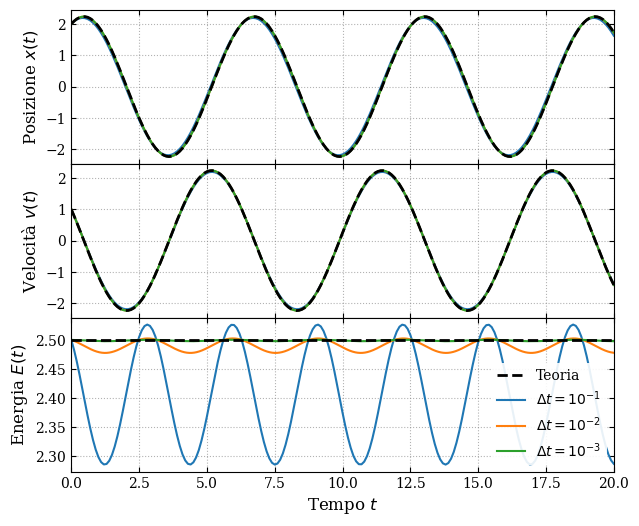
def plot_xvE(base_folder, filename, folders, legend_loc='upper left'):
# --- Publication Quality Styling ---
plt.rcParams.update({
"font.family": "serif",
"font.size": 11,
"axes.labelsize": 12,
"axes.titlesize": 12,
"xtick.labelsize": 10,
"ytick.labelsize": 10,
"legend.fontsize": 10,
"figure.titlesize": 14,
"text.usetex": False
})
display_labels = {}
for folder in folders:
# Extract the '1e-1' part from 'DT_1e-1'
raw_num = folder.split('_')[1] # returns "1e-1"
# Split by 'e' to get the base and the exponent
base, exponent = raw_num.split('e') # base="1", exponent="-1"
# Strip any leading zeros or plus signs from the exponent, keeping it clean
exponent = int(exponent)
# Format as a raw LaTeX string for Matplotlib
display_labels[folder] = rf'$\Delta t = 10^{{{exponent}}}$'
# Explicitly define the column schema
# This bypasses the skipped header and maps directly to the data rows
column_names = ['t', 'x', 'v', 'E', 'x_th', 'v_th', 'E_th']
fig, axs = plt.subplots(3, 1, figsize=(7, 6), sharex=True)
for i, folder in enumerate(folders):
file_path = os.path.join(base_folder, folder, filename)
if not os.path.exists(file_path):
print(f"Warning: {file_path} not found. Skipping.")
continue
# By passing 'names', pandas ignores all '#' lines but knows exactly
# what to call your dataset columns.
df = pd.read_csv(file_path, sep=r'\s+', comment='#', names=column_names)
# Plot theoretical curve once
if i == 0:
theory_style = {'color': 'black', 'linestyle': '--', 'linewidth': 2.0, 'label': 'Teoria', 'zorder': 5}
axs[0].plot(df['t'], df['x_th'], **theory_style)
axs[1].plot(df['t'], df['v_th'], **theory_style)
axs[2].plot(df['t'], df['E_th'], **theory_style)
# Plot experimental data
axs[0].plot(df['t'], df['x'], label=display_labels[folder], linewidth=1.5)
axs[1].plot(df['t'], df['v'], label=display_labels[folder], linewidth=1.5)
axs[2].plot(df['t'], df['E'], label=display_labels[folder], linewidth=1.5)
axs[0].set_ylabel(r'Posizione $x(t)$')
axs[1].set_ylabel(r'Velocità $v(t)$')
axs[2].set_ylabel(r'Energia $E(t)$')
axs[2].set_xlabel(r'Tempo $t$')
for ax in axs:
ax.set_xlim(df['t'].min(), df['t'].max())
ax.grid(True, linestyle=':', alpha=0.6, color='gray')
ax.tick_params(direction='in', which='major', top=True, right=True)
# Keep axis intervals tight and clean
ax.xaxis.set_major_locator(ticker.MaxNLocator(nbins=8))
ax.yaxis.set_major_locator(ticker.MaxNLocator(nbins=6))
axs[2].legend(loc=legend_loc, frameon=True, facecolor='white', edgecolor='none', framealpha=0.9)
plt.subplots_adjust(hspace=0.0)
#output_name = filename.split(".")[0] + ".png"
#plt.savefig(output_name, dpi=300, bbox_inches='tight')
#plt.show()
return figfig_eulero = plot_xvE(base_folder=BASE_FOLDER, filename="res_eulero.dat", folders=['DT_1e-1', 'DT_1e-2', 'DT_1e-3'])
fig_eulero_cromer = plot_xvE(base_folder=BASE_FOLDER, filename="res_eulero_cromer.dat", folders=['DT_1e-1', 'DT_1e-2', 'DT_1e-3'], legend_loc="best")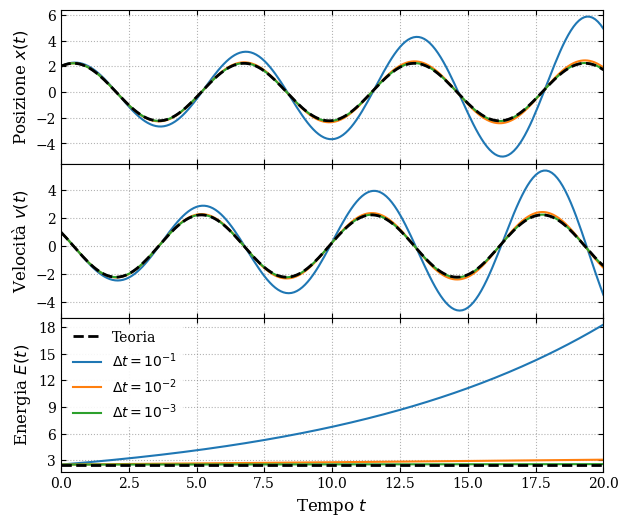
fig_eulerofig_eulero_cromerdef plot_errors(base_folder, files, ref_lines={}, legend_loc='upper left'):
# --- Publication Quality Styling ---
plt.rcParams.update({
"font.family": "serif",
"font.size": 11,
"axes.labelsize": 12,
"axes.titlesize": 12,
"xtick.labelsize": 10,
"ytick.labelsize": 10,
"legend.fontsize": 10,
"figure.titlesize": 14,
"text.usetex": False
})
fig, ax = plt.subplots()
ax.set_xlabel(r'$\Delta t$')
ax.set_ylabel(r'Errore globale $\epsilon_G$')
# We need to track the absolute limits of dt to plot our reference line accurately
data = {}
for k, v in files.items():
dt, err = np.loadtxt(os.path.join(base_folder, v), unpack=True)
ax.plot(dt, err, 'o--', label=k)
ax.set_xscale("log")
ax.set_yscale("log")
xlim = ax.get_xlim()
ylim = ax.get_ylim()
# Draw the reference lines
for exp, err_from in ref_lines.items():
dt_from = 1e-4
dt_to = 1.0
err_to = err_from * (dt_to / dt_from)**exp
ax.autoscale()
ax.plot([dt_from, dt_to], [err_from, err_to], label=rf"$\Delta t^{exp}$", alpha=0.5)
# Freeze the limits back to just the simulation data bounds
ax.set_xlim(xlim)
ax.set_ylim(ylim)
ax.legend(loc=legend_loc, frameon=True, facecolor='white', edgecolor='none', framealpha=0.9)
return fig
files = {
"Eulero" : "error_eulero.dat",
"Eulero-Cromer" : "error_eulero_cromer.dat"
}
ref_lines = {
1 : 4e-4
}
fig_e_ec_errors = plot_errors(BASE_FOLDER, files, ref_lines=ref_lines)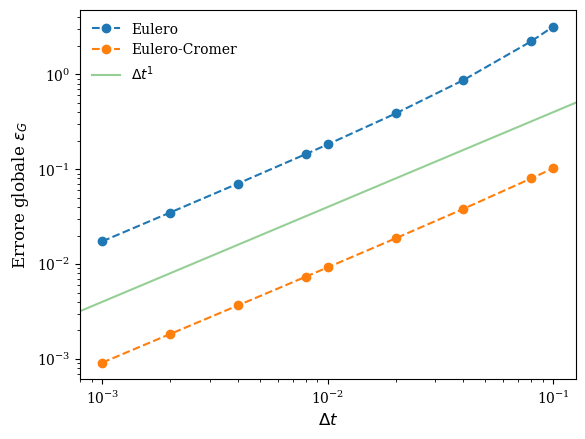
fig_e_ec_errorsfiles = {
"Eulero" : "error_eulero.dat",
"Eulero-Cromer" : "error_eulero_cromer.dat",
"Velocity Verlet" : "error_velocity_Verlet.dat"
}
ref_lines = {
1 : 4e-4,
2 : 1e-7
}
fig_vv_errors = plot_errors(BASE_FOLDER, files, ref_lines=ref_lines, legend_loc="lower right")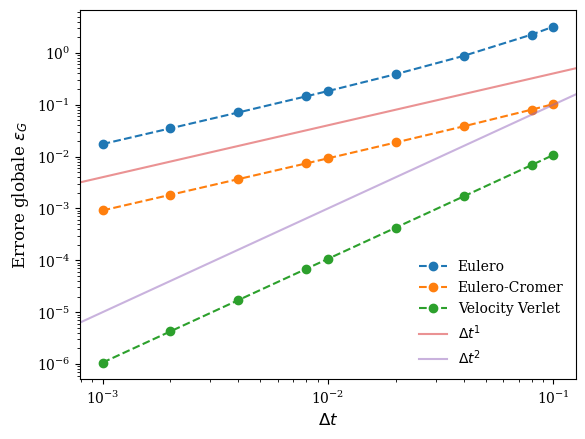
fig_vv_errorsfiles = {
"Eulero" : "error_eulero.dat",
"Eulero-Cromer" : "error_eulero_cromer.dat",
"Velocity Verlet" : "error_velocity_Verlet.dat",
"Runge-Kutta 2" : "error_rk2.dat",
"Runge-Kutta 4" : "error_rk4.dat",
}
ref_lines = {
1 : 4e-4,
2 : 1e-7,
4 : 1e-15
}
fig_rk_errors = plot_errors(BASE_FOLDER, files, ref_lines=ref_lines, legend_loc="lower right")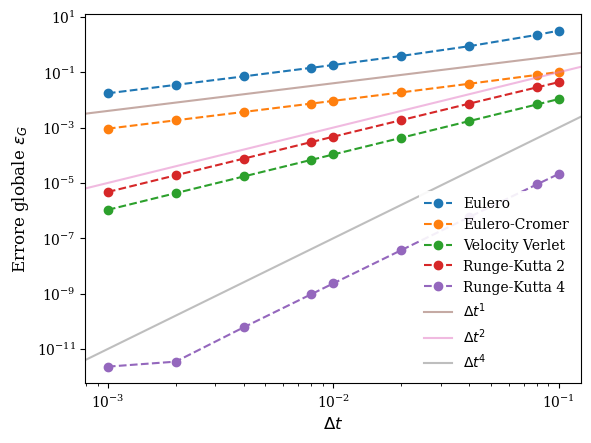
fig_rk_errors# Parametri fisici e di simulazione
omega = 1.0
T = 2 * np.pi / omega
dt = 0.1
num_steps = int(2 * T / dt) # due giri completi
# Matrice di evoluzione per Eulero-Cromer (det = 1)
M_cromer = np.array([[1 - omega**2 * dt**2, dt],
[-omega**2 * dt, 1]])
# Matrice di evoluzione per Eulero Esplicito (det > 1)
M_explicit = np.array([[1, dt],
[-omega**2 * dt, 1]])
# Vertici del quadrato iniziale nello spazio delle fasi (x, v)
vertices_init = np.array([
[1.0, 1.5, 1.5, 1.0], # Coordinate x
[0.0, 0.0, 0.5, 0.5] # Coordinate v
])
# Setup del grafico
fig, ax = plt.subplots(figsize=(6, 6))
ax.set_xlim(-2.5, 2.5)
ax.set_ylim(-2.5, 2.5)
ax.set_xlabel('Posizione (x)')
ax.set_ylabel('Velocità (v)')
ax.grid(True, linestyle='--')
# Creiamo i poligoni da animare
poly_explicit = patches.Polygon(vertices_init.T, closed=True, fc='red', alpha=0.3, label='Eulero')
poly_cromer = patches.Polygon(vertices_init.T, closed=True, fc='blue', alpha=0.5, label='Eulero-Cromer')
ax.add_patch(poly_explicit)
ax.add_patch(poly_cromer)
ax.legend(loc='upper right')
# Copiamo le condizioni iniziali dei vertici
v_cromer = vertices_init.copy()
v_explicit = vertices_init.copy()
def update(frame):
global v_cromer, v_explicit
# Il frame 0 mostra le vere condizioni iniziali (t = 0), mentre dal frame 1 in poi il sistema si evolve un passo alla volta
if frame > 0:
v_cromer = M_cromer @ v_cromer
v_explicit = M_explicit @ v_explicit
# Aggiorna la geometria dei poligoni
poly_cromer.set_xy(v_cromer.T)
poly_explicit.set_xy(v_explicit.T)
return poly_cromer, poly_explicit
# Generazione dell'animazione
ani = animation.FuncAnimation(fig, update, frames=num_steps, interval=100, blit=True)
plt.close(fig) # Chiude la figura statica per evitare doppioni vuoti nella cellaHTML(ani.to_jshtml(default_mode="once")) # Converte l'animazione in codice HTML/JS e la mostra a schermoLoading...
files = {
    "Eulero" : "error_eulero.dat",
    "Eulero-Cromer" : "error_eulero_cromer.dat",
    "Velocity Verlet" : "error_velocity_Verlet.dat",
}
ref_lines = {
    1 : 4e-5,
    2 : 1e-8,
}
fig_damped_nork_errors = plot_errors("../../../CODICI/DAMPED_HARMONIC_OSCILLATOR", files, ref_lines=ref_lines, legend_loc="upper left")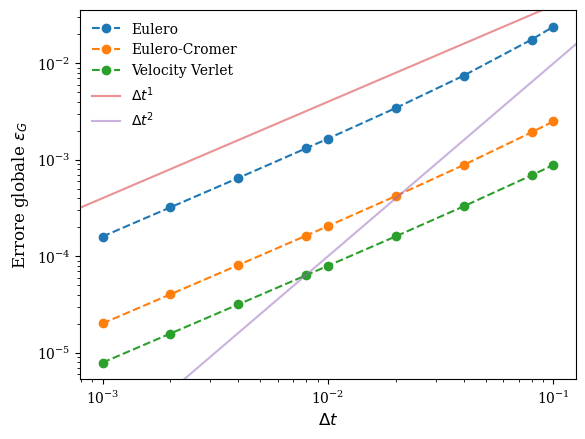
fig_damped_nork_errorsfiles = {
"Eulero" : "error_eulero.dat",
"Eulero-Cromer" : "error_eulero_cromer.dat",
"Velocity Verlet" : "error_velocity_Verlet.dat",
"Runge-Kutta 2" : "error_rk2.dat",
"Runge-Kutta 4" : "error_rk4.dat",
}
ref_lines = {
1 : 4e-6,
2 : 1e-10,
4 : 1e-18
}
fig_damped_errors = plot_errors("../../../CODICI/DAMPED_HARMONIC_OSCILLATOR", files, ref_lines=ref_lines, legend_loc="lower right")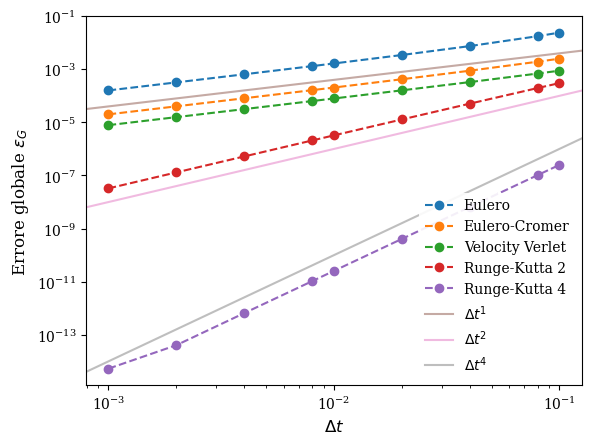
fig_damped_errorsdef plot_xvE_methods(base_folder, methods, legend_loc='upper left'):
# --- Publication Quality Styling ---
plt.rcParams.update({
"font.family": "serif",
"font.size": 11,
"axes.labelsize": 12,
"axes.titlesize": 12,
"xtick.labelsize": 10,
"ytick.labelsize": 10,
"legend.fontsize": 10,
"figure.titlesize": 14,
"text.usetex": False
})
# Explicitly define the column schema
# This bypasses the skipped header and maps directly to the data rows
column_names = ['t', 'x', 'v', 'E', 'x_th', 'v_th', 'E_th']
fig, axs = plt.subplots(3, 1, figsize=(7, 6), sharex=True)
for method, filename in methods.items():
file_path = os.path.join(base_folder, filename)
if not os.path.exists(file_path):
print(f"Warning: {file_path} not found. Skipping.")
continue
# By passing 'names', pandas ignores all '#' lines but knows exactly
# what to call your dataset columns.
df = pd.read_csv(file_path, sep=r'\s+', comment='#', names=column_names)
# Plot experimental data
axs[0].plot(df['t'], df['x'], label=method, linewidth=1.5)
axs[1].plot(df['t'], df['v'], label=method, linewidth=1.5)
axs[2].plot(df['t'], df['E'], label=method, linewidth=1.5)
axs[0].set_ylabel(r'$\theta(t)$ [rad]')
axs[1].set_ylabel(r'$\omega(t)$ [rad/s]')
axs[2].set_ylabel(r'$E(t)$ [J]')
axs[2].set_xlabel(r'$t$ [s]')
for ax in axs:
ax.set_xlim(df['t'].min(), df['t'].max())
ax.grid(True, linestyle=':', alpha=0.6, color='gray')
ax.tick_params(direction='in', which='major', top=True, right=True)
# Keep axis intervals tight and clean
ax.xaxis.set_major_locator(ticker.MaxNLocator(nbins=8))
ax.yaxis.set_major_locator(ticker.MaxNLocator(nbins=6))
axs[2].legend(loc=legend_loc, frameon=True, facecolor='white', edgecolor='none', framealpha=0.9)
plt.subplots_adjust(hspace=0.0)
#output_name = filename.split(".")[0] + ".png"
#plt.savefig(output_name, dpi=300, bbox_inches='tight')
#plt.show()
return fig
methods = {
"Eulero" : "res_eulero.dat",
"Eulero-Cromer" : "res_eulero_cromer.dat",
"Velocity Verlet" : "res_velocity_Verlet.dat"
}
fig_pendulum_xvE = plot_xvE_methods("../../../CODICI/PENDULUM/DT_1e-2", methods, legend_loc='upper left')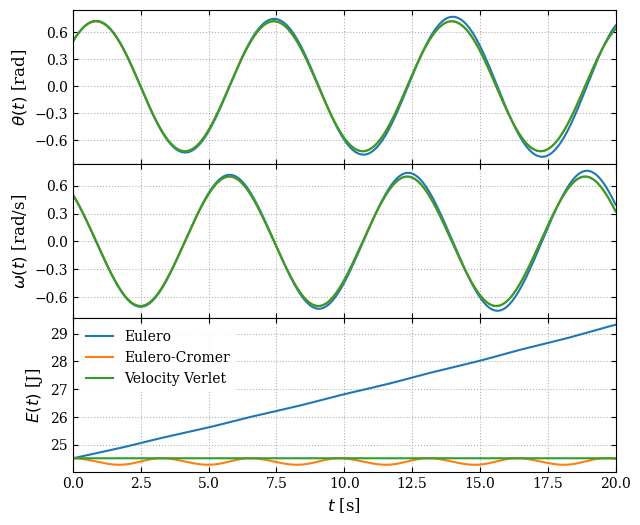
fig_pendulum_xvEdef plot_pendulum_errors(base_folder, methods, ref_lines, legend_loc='upper left'):
# --- Publication Quality Styling ---
plt.rcParams.update({
"font.family": "serif",
"font.size": 11,
"axes.labelsize": 12,
"axes.titlesize": 12,
"xtick.labelsize": 10,
"ytick.labelsize": 10,
"legend.fontsize": 10,
"figure.titlesize": 14,
"text.usetex": False
})
fig, axs = plt.subplots(2, 1, figsize=(7, 6), sharex=True)
for method, base_filename in methods.items():
for i, error_type in enumerate(["maxE", "stdE"]):
file_path = os.path.join(base_folder, error_type + base_filename)
if not os.path.exists(file_path):
print(f"Warning: {file_path} not found. Skipping.")
continue
x, y = np.loadtxt(file_path, unpack=True)
axs[i].plot(x, y, 'o--', label=method, linewidth=1.5)
axs[0].set_ylabel(r'$\epsilon_E$ [J]')
axs[1].set_ylabel(r'$\sigma_E$ [J]')
axs[1].set_xlabel(r'$\Delta t$ [s]')
for ax in axs:
ax.set_xscale("log")
ax.set_yscale("log")
xlim = ax.get_xlim()
ylim = ax.get_ylim()
# Draw the reference lines
for exp, err_from in ref_lines.items():
dt_from = 1e-4
dt_to = 1.0
err_to = err_from * (dt_to / dt_from)**exp
ax.autoscale()
ax.plot([dt_from, dt_to], [err_from, err_to], label=rf"$\Delta t^{exp}$", alpha=0.5)
# Freeze the limits back to just the simulation data bounds
ax.set_xlim(xlim)
ax.set_ylim(ylim)
'''ax.set_xlim(x.min(), x.max())
ax.grid(True, linestyle=':', alpha=0.6, color='gray')
ax.tick_params(direction='in', which='major', top=True, right=True)
ax.set_xscale("log")
ax.set_yscale("log")
# Keep axis intervals tight and clean
ax.xaxis.set_major_locator(ticker.MaxNLocator(nbins=8))
ax.yaxis.set_major_locator(ticker.MaxNLocator(nbins=6))'''
axs[1].legend(loc=legend_loc, frameon=True, facecolor='white', edgecolor='none', framealpha=0.9)
plt.subplots_adjust(hspace=0.0)
#output_name = filename.split(".")[0] + ".png"
#plt.savefig(output_name, dpi=300, bbox_inches='tight')
#plt.show()
return fig
methods = {
"Eulero" : "_eulero.dat",
"Eulero-Cromer" : "_eulero_cromer.dat",
"Velocity Verlet" : "_velocity_Verlet.dat"
}
ref_lines = {
1 : 5e-3,
2 : 1e-7
}
fig_pendulum_errors = plot_pendulum_errors("../../../CODICI/PENDULUM/", methods, ref_lines, legend_loc='lower right')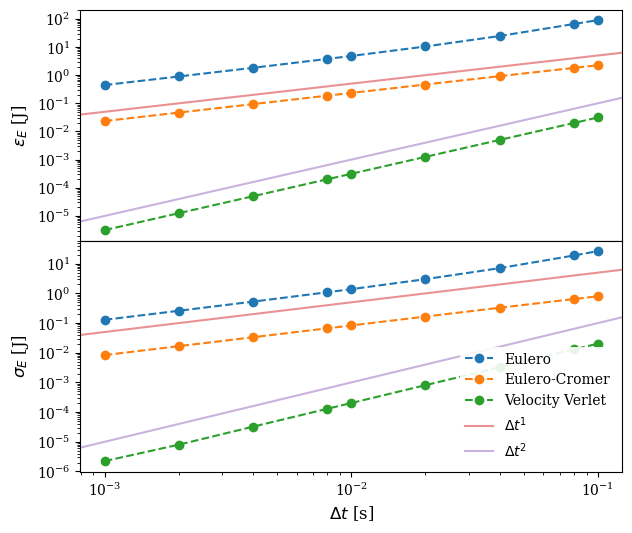
fig_pendulum_errors